How to check server status in WHM/cPanel
To check the status of server in WHM/cPanel
In this article we will discuss about how to check the server status in WHM. It provides access to several list to display information about your server. It is helpful when you troubleshoot hardware or software issues.
First Login to the WHM page with root user.
In the Home page, select the server status.
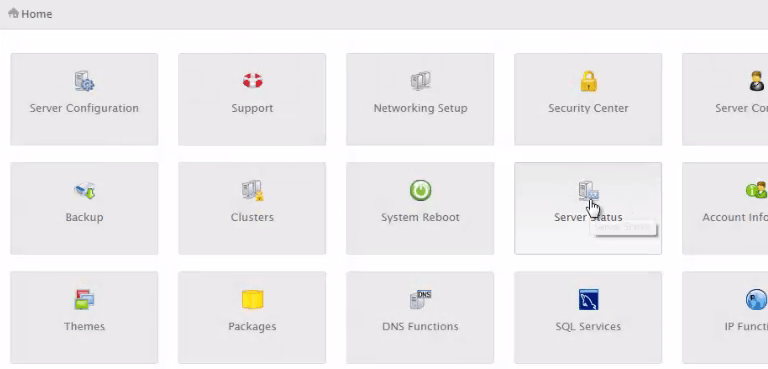
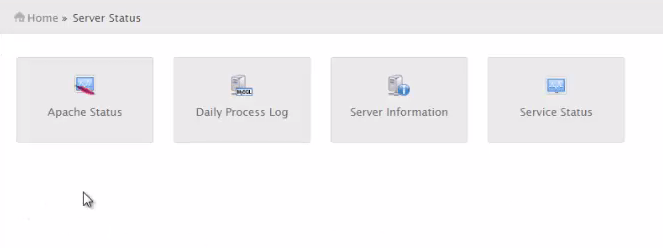
The server status has four sections
- Apache Status
- Daily Process Log
- Server Information
- Service Status
Apache status
Apache is a web server which responds to HTTP requests and serves web pages.
For instance, if user requests your domain, www.example.linuxhelp.com, from a web browser, Apache serves the index page for www.example.linuxhelp.com.
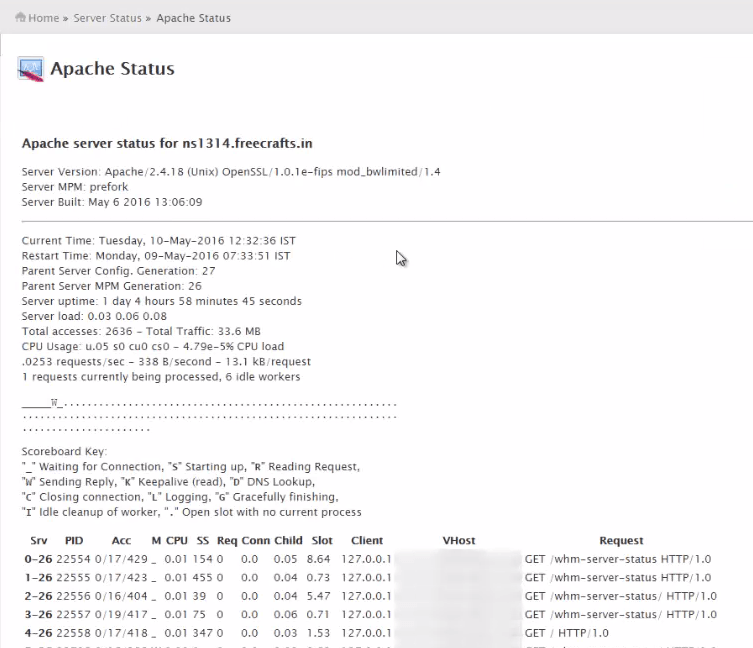
It displays the complete status of the Apache server like Server Version, Server Built time, Current Time, restart time, server uptime, CPU usage and which Multi Processing Module is used
Daily process log
It displays the list of processes running in the server. It also displays the server' s consumption of processing power and memory. In this Daily log interface you can view the yesterday' s, current and tomorrow' s dates.
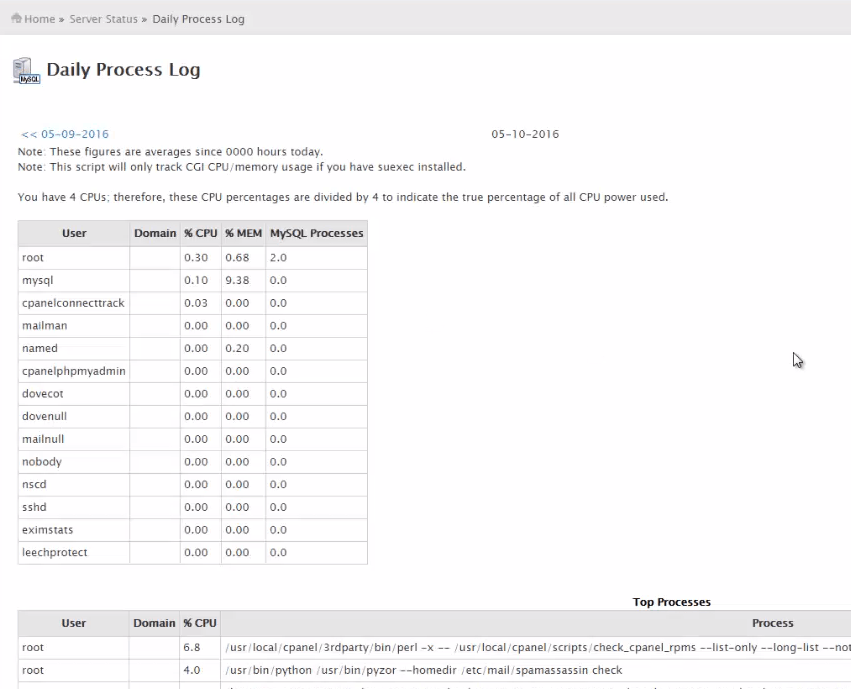
It also displays the information about the user, domain name, MySQL processes, CPU and the memory utilization. The process which consumes time is also displayed in the top process section with that particular CPU percentage, user and domain name.
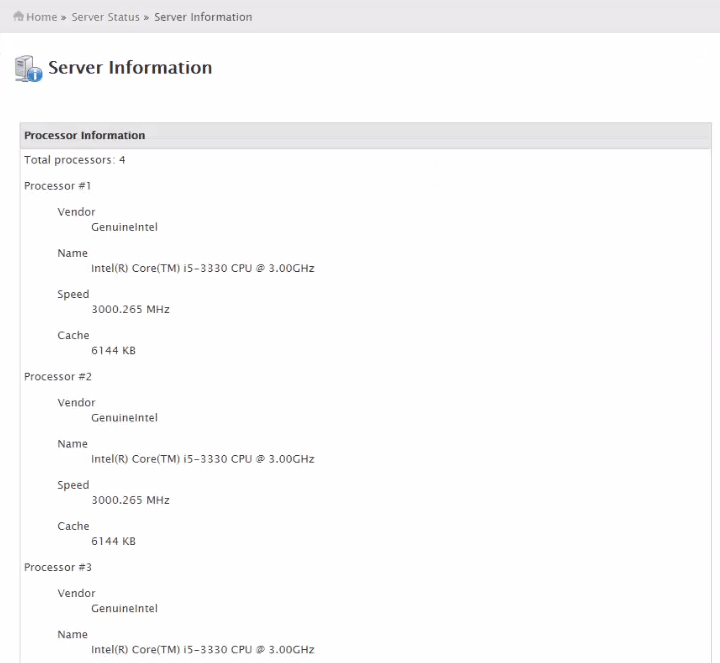
Server Information
It provides the complete information about the server hardware information' s such as total number of processors, speed of the processor etc.
It also displays the complete details about the individual processor with vendor name, name of processor, speed and the cache details.
It also displays the memory, RAM information, system information etc. The physical disk memory contains each and every disks which i have allocated for the partition.
The current memory usage displays how much swap memory and RAM memory is used. Current Disk Usage shows the current usage of the partitions.
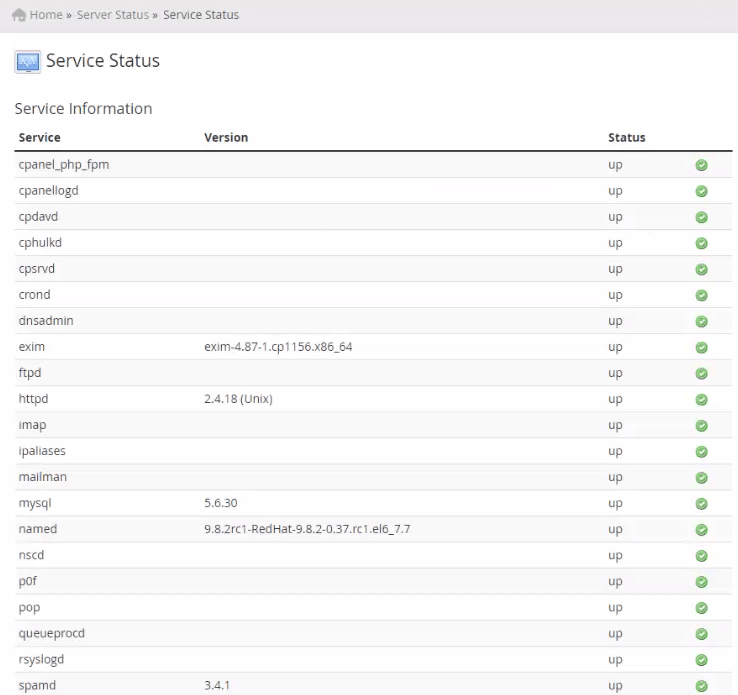
Service Status
It displays all the services monitored by the server with the version, service information and the status of the service.
The active function displays is represented in green tick and the inactive function displays is represented in red icon.
In the system information, it lists the server' s load, current memory, RAM memory, swap memory and the status of the services.
Comments ( 0 )
No comments available