How to install Kibana on CentOS 7.4
To install Kibana on CentOS 7.4
Kibana is an open source data visualization and exploration tool for Elasticsearch. It is used for log and time series analytics, application monitoring, and operational intelligence use cases. Kibana provides a neat dashboard web interface and allows you to manage and visualize data from Elasticsearch. Kibana is also popular due to its powerful and easy-to-use features such as histograms, line graphs, pie charts, heat maps and built-in geospatial support. In a nutshell, Kibana is not just beautiful, but also powerful. Installing Kibana is not really that hard, and this article covers the method to install Kibana on CentOS 7.4.
Installing Kibana
In order to install Kibana, you need a stable and latest installation package, so make sure you run the following wget command followed by its download link.
[root@localhost ~]# wget https://artifacts.elastic.co/downloads/kibana/kibana-6.0.1-x86_64.rpm
--2017-12-15 12:25:51--  https://artifacts.elastic.co/downloads/kibana/kibana-6.0.1-x86_64.rpm
Resolving artifacts.elastic.co (artifacts.elastic.co)... 54.225.188.6, 54.235.82.130, 184.73.156.41, ...
Connecting to artifacts.elastic.co (artifacts.elastic.co)|54.225.188.6|:443... connected.
HTTP request sent, awaiting response... 200 OK
Length: 64011211 (61M) [application/octet-stream]
Saving to: ‘ kibana-6.0.1-x86_64.rpm’

100%[======================================> ] 64,011,211   290KB/s   in 4m 11s

2017-12-15 12:30:04 (249 KB/s) - ‘ kibana-6.0.1-x86_64.rpm’  saved [64011211/64011211]
Once it is done, you shall install Kibana in the following manner.
[root@localhost ~]# rpm -ivh kibana-6.0.1-x86_64.rpm
warning: kibana-6.0.1-x86_64.rpm: Header V4 RSA/SHA512 Signature, key ID d88e42b4: NOKEY
Preparing...                          ################################# [100%]
Updating / installing...
   1:kibana-6.0.1-1                   ################################# [100%]
Next, you need to configure Kibana. So, open the Kibana configuration file.
[root@localhost ~]# vim /etc/kibana/kibana.yml
And, uncomment your server port and server host and give the IP address.
server.port: 5601
server.host: " 192.168.7.218"
In order to communicate with clusters enable and provide elastic search URL
elasticsearch.url: http://192.168.7.218:9200
Save and exit from it once it is done.
After that configuration, you need to start and enable Kibana application by running the following commands.
[root@localhost ~]# systemctl enable kibana
[root@localhost ~]# systemctl start kibana
Also, check if your Kibana is in LISTEN state.
[root@localhost ~]# netstat -plntu | grep LISTEN
.
.
.
.
.
tcp        0      0 192.168.7.218:5601      0.0.0.0:*               LISTEN      2654/node
tcp6       0      0 192.168.7.218:9200      :::*                    LISTEN      2301/java
.
.
You can launch ElasticSearch. Type http://192.168.7.218:5601 in the browser. Kibana is getting loaded.
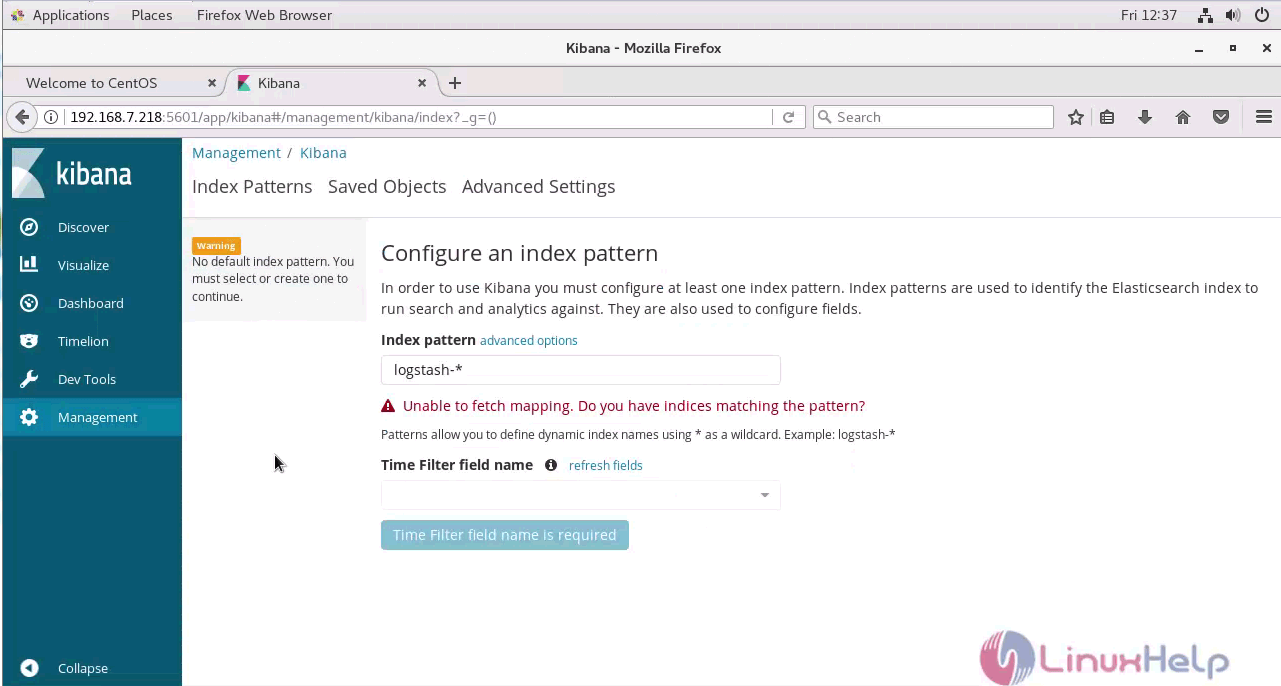
You can check the Management module.
Also, the Kibana dashboard looks like the one in the following image.
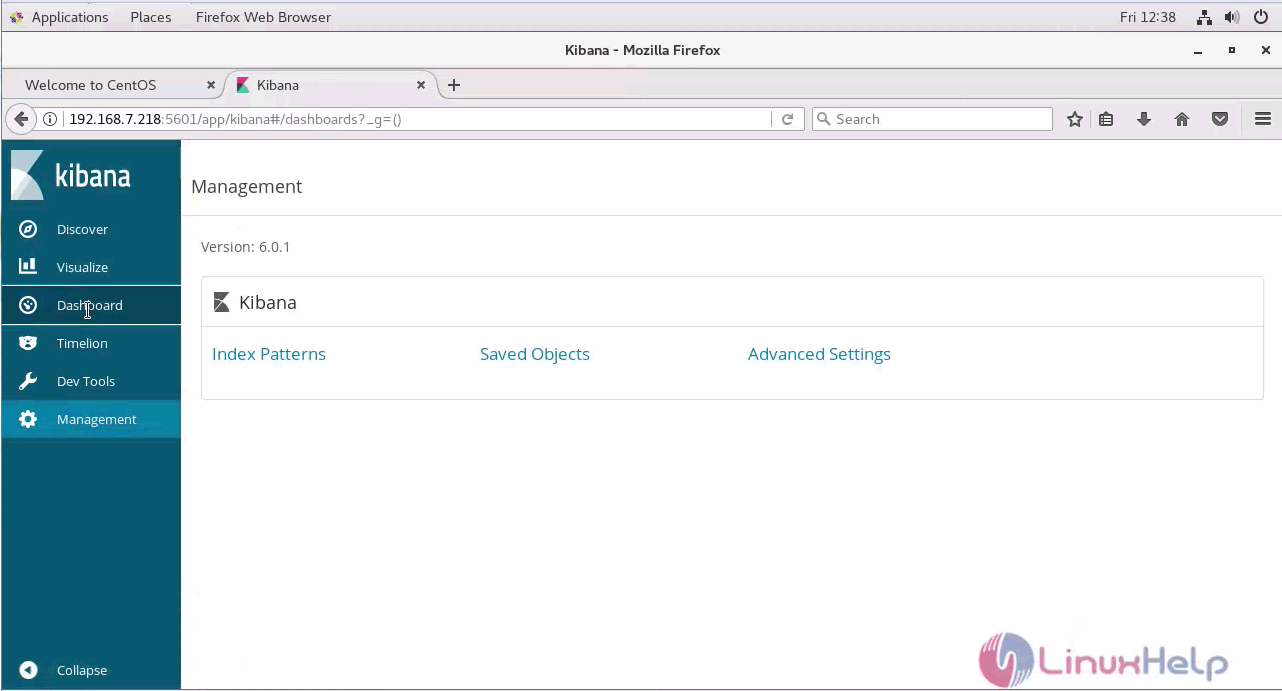
With this, the installation of Kibana comes to an end.
Comments ( 0 )
No comments available