How to Install SMEM Memory Usage Tool in Ubuntu
To Install SMEM Memory Usage Tool in Ubuntu
SMEM is an open source memory reporting tool that provides memory usage reports in Linux system. It displays the output in meaningful representation. SMEM reports Unique Set Size (USS) and Proportional Set Size (PSS) by using the standard measure of memory known as Resident Set Size(RSS).
Features
- Configurable output units and percentages
- Configurable headers and totals
- Read live data from /proc
- Read data snapshots from compressed tarballs
- Lightweight capture tool
- List and filter output by process, mapping, user
Installation of SMEM
Utilize the following command to install the SMEM package.
root@linuxhelp:/home/user1# apt-get install smem
Reading package lists... Done
Building dependency tree
Reading state information... Done
.
.
.
Setting up smem (1.4-2) ...
Processing triggers for libc-bin (2.21-0ubuntu4) ...
Command Usage
The ' -m' used to check the memory usage by mapping.
root@linuxhelp:/home/user1# smem -m
Map                                       PIDs   AVGPSS      PSS
/dev/dri/card0                               2        0        0
/usr/lib/x86_64-linux-gnu/gconv/gconv-mo    35        0        0
/usr/share/locale-langpack/en/LC_MESSAGE    14        0        0
/var/cache/fontconfig/0c9eb80ebd1c36541e    17        0        0
.
.
.
/usr/lib/x86_64-linux-gnu/libLLVM-3.6.so     2    11342    22684
                                117     1703   199336
[heap]                                     116     1867   216580
The ' -w' used to check the system wide memory usage.
root@linuxhelp:/home/user1# smem -w
Area                           Used      Cache   Noncache
firmware/hardware                 0          0          0
kernel image                      0          0          0
kernel dynamic memory       1894076    1639584     254492
userspace memory             740720     196592     544128
free memory                 1394488    1394488          0
The ' -u' used to check the memory usage for each user.
root@linuxhelp:/home/user1# smem -u
User     Count     Swap      USS      PSS      RSS
uuidd        1        0      232      274     2520
rtkit        1        0      372      400     2996
.
.
.
root        33        0   102908   118292   269020
user1       71        0   464508   525870  1303292

The following command allows you to filter the specific process or application reports.

root@linuxhelp:/home/user1# smem --processfilter=" python"
  PID User     Command                         Swap      USS      PSS      RSS
10603 root     /usr/bin/python /usr/bin/sm        0     5908     5936     8280
The ' -p' is used to view the memory usage in percentage mode.
root@linuxhelp:/home/user1# smem -p
  PID User     Command                         Swap      USS      PSS      RSS
 4331 user1    gnome-pty-helper               0.00%    0.00%    0.00%    0.04%
 9101 root     logger -t mysqld -p daemon     0.00%    0.00%    0.01%    0.07%
 8947 root     logger -p daemon err -t /et    0.00%    0.00%    0.01%    0.07%
.
.
.
2107 user1    /usr/lib/evolution/evolutio    0.00%    0.08%    0.11%    0.44%
2244 user1    /usr/lib/x86_64-linux-gnu/z    0.00%    0.07%    0.11%    0.39%
1809 user1    compiz                         0.00%    4.11%    4.28%    5.07%
The ' -tp' is used to view grant total of memory usage reports.
root@linuxhelp:/home/user1# smem -tp
  PID User     Command                         Swap      USS      PSS      RSS
 4331 user1    gnome-pty-helper               0.00%    0.00%    0.00%    0.04%
 9101 root     logger -t mysqld -p daemon     0.00%    0.00%    0.01%    0.07%
 8947 root     logger -p daemon err -t /et    0.00%    0.00%    0.01%    0.07%
.
.
.
9100 mysql    /usr/sbin/mysqld --basedir=    0.00%    2.13%    2.13%    2.23%
 1809 user1    compiz                         0.00%    4.11%    4.28%    5.07%
-------------------------------------------------------------------------------
  116 13                                      0.00%   16.48%   18.43%   42.60%
To display the specific field reports, use the following command.
root@linuxhelp:/home/user1# smem --column " name user pss rss"
Name                     User          PSS      RSS
gnome-pty-helpe          user1         180     1812
logger                   root          250     2684
logger                   root          251     2784
.
.
.
mysqld                   mysql       85758    89764
compiz                   user1      172896   204472
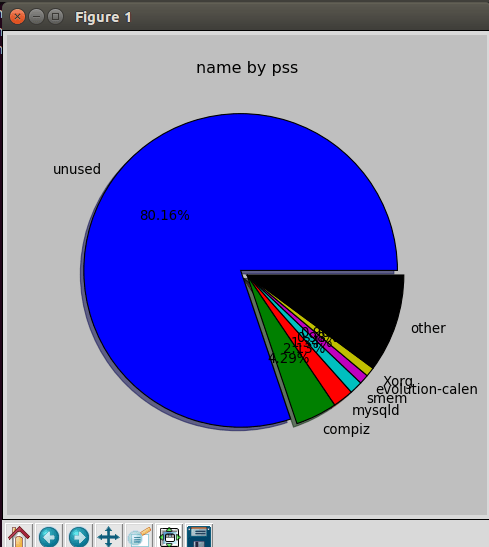
If you want to view the memory usage in pie-chart format, run the following command.
root@linuxhelp:/home/user1# smem --pie name -s rss
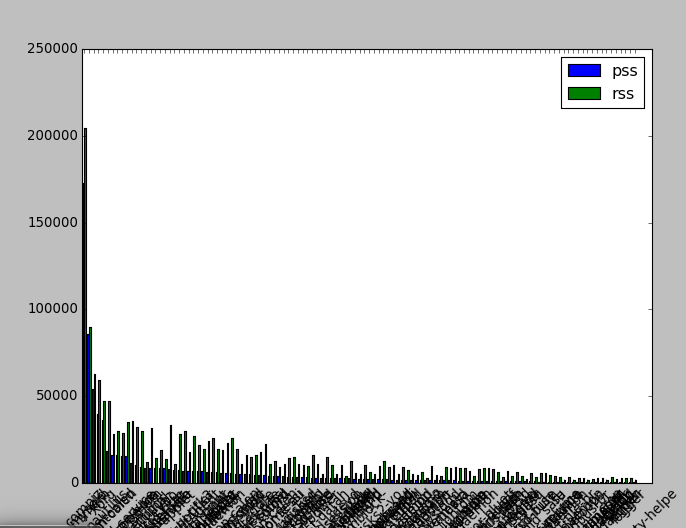
You can also view your memory usage reports in bar diagram format with the help of below command.
root@linuxhelp:/home/user1# smem --bar name -c " pss rss"
Comments ( 0 )
No comments available