How to install Grafana on Linux Debian 11.3
- 00:25 lsb_release -a
- 00:33 ip a
- 00:43 wget -qO- https://packages.grafana.com/gpg.key | sudo apt-key add -
- 01:07 echo "deb https://packages.grafana.com/oss/deb stable main" | sudo tee -a /etc/apt/sources.list.d/grafana.list
- 01:24 apt update
- 01:34 apt list --upgradable
- 01:50 apt-get install grafana -y
- 02:15 systemctl daemon-reload
- 02:29 systemctl start grafana-server
- 02:44 systemctl enable grafana-server
To Install Grafana On Linux Debian 11.3
Introduction :
Grafana is a multi-platform open source analytics and interactive visualization web application. It provides charts, graphs, and alerts for the web when connected to supported data sources.
Installation procedure :
Step 1 : Check the OS version by using the below command
root@linuxhelp:~# lsb_release -a
No LSB modules are available.
Distributor ID: Debian
Description:    Debian GNU/Linux 11 (bullseye)
Release:        11
Codename:       bullseye
Step 2 : Check the IP address by using the below command
root@linuxhelp:~# ip a
1: lo: <LOOPBACK,UP,LOWER_UP> mtu 65536 qdisc noqueue state UNKNOWN group default qlen 1000
    link/loopback 00:00:00:00:00:00 brd 00:00:00:00:00:00
    inet 127.0.0.1/8 scope host lo
       valid_lft forever preferred_lft forever
    inet6 ::1/128 scope host
       valid_lft forever preferred_lft forever
2: ens33: <BROADCAST,MULTICAST,UP,LOWER_UP> mtu 1500 qdisc pfifo_fast state UP group default qlen 1000
    link/ether 00:0c:29:f2:4d:6c brd ff:ff:ff:ff:ff:ff
    altname enp2s1
    inet 192.168.6.133/23 brd 192.168.7.255 scope global noprefixroute ens33
       valid_lft forever preferred_lft forever
    inet6 fe80::b6ad:ef36:1ad2:bcbb/64 scope link noprefixroute
       valid_lft forever preferred_lft forever
Step 3 : Add the new repository key by using the below command
root@linuxhelp:~# wget -qO- https://packages.grafana.com/gpg.key | sudo apt-key add -
OK
Step 4 : Add a repository to install Grafana by using the below command
root@linuxhelp:~# echo "deb https://packages.grafana.com/oss/deb stable main" | sudo tee -a /etc/apt/sources.list.d/grafana.list
deb https://packages.grafana.com/oss/deb stable main
Step 5 : Update the repository by using the below command
root@linuxhelp:~# apt update
Hit:1 http://deb.debian.org/debian bullseye InRelease
Hit:2 http://security.debian.org/debian-security bullseye-security InRelease
Hit:3 http://deb.debian.org/debian bullseye-updates InRelease
Get:4 https://packages.grafana.com/oss/deb stable InRelease [12.1 kB]
Get:5 https://packages.grafana.com/oss/deb stable/main amd64 Packages [31.5 kB]
Fetched 43.6 kB in 1s (31.1 kB/s)
Reading package lists... Done
Building dependency tree... Done
Reading state information... Done
121 packages can be upgraded. Run 'apt list --upgradable' to see them.
Step 6 : Update the repository by using the below command
root@linuxhelp:~# apt list --upgradable
Listing... Done
cups-client/stable-security 2.3.3op2-3+deb11u2 amd64 [upgradable from: 2.3.3op2-3+deb11u1]
cups-common/stable-security 2.3.3op2-3+deb11u2 all [upgradable from: 2.3.3op2-3+deb11u1]
cups-core-drivers/stable-security 2.3.3op2-3+deb11u2 amd64 [upgradable from: 2.3.3op2-3+deb11u1]
cups-daemon/stable-security 2.3.3op2-3+deb11u2 amd64 [upgradable from: 2.3.3op2-3+deb11u1]
cups-ipp-utils/stable-security 2.3.3op2-3+deb11u2 amd64 [upgradable from: 2.3.3op2-3+deb11u1]
cups-ppdc/stable-security 2.3.3op2-3+deb11u2 amd64 [upgradable from: 2.3.3op2-3+deb11u1]
cups-server-common/stable-security 2.3.3op2-3+deb11u2 all [upgradable from: 2.3.3op2-3+deb11u1]
Step 7 : Install Grafana by using the below command
root@linuxhelp:~# apt-get install grafana -y
Reading package lists... Done
Building dependency tree... Done
Reading state information... Done
The following NEW packages will be installed:
  grafana
0 upgraded, 1 newly installed, 0 to remove and 121 not upgraded.
Need to get 80.0 MB of archives.
Adding new user `grafana' (UID 120) with group `grafana' ...
Not creating home directory `/usr/share/grafana'.
###NOT starting on installation, please execute the following statements to configure grafana to start automatically using systemd
 sudo /bin/systemctl daemon-reload
 sudo /bin/systemctl enable grafana-server
###You can start grafana-server by executing
 sudo /bin/systemctl start grafana-server
Step 8 : Reload the Daemon’s service by using the below command
root@linuxhelp:~# systemctl daemon-reload
Step 9: Start the Grafana service by using the below command
root@linuxhelp:~# systemctl start grafana-server
Step 10: Enable the Grafana service by using the below command
root@linuxhelp:~# systemctl enable grafana-server
Synchronizing state of grafana-server.service with SysV service script with /lib/systemd/systemd-sysv-install.
Executing: /lib/systemd/systemd-sysv-install enable grafana-server
Created symlink /etc/systemd/system/multi-user.target.wants/grafana-server.service → /lib/systemd/system/grafana-server.service.
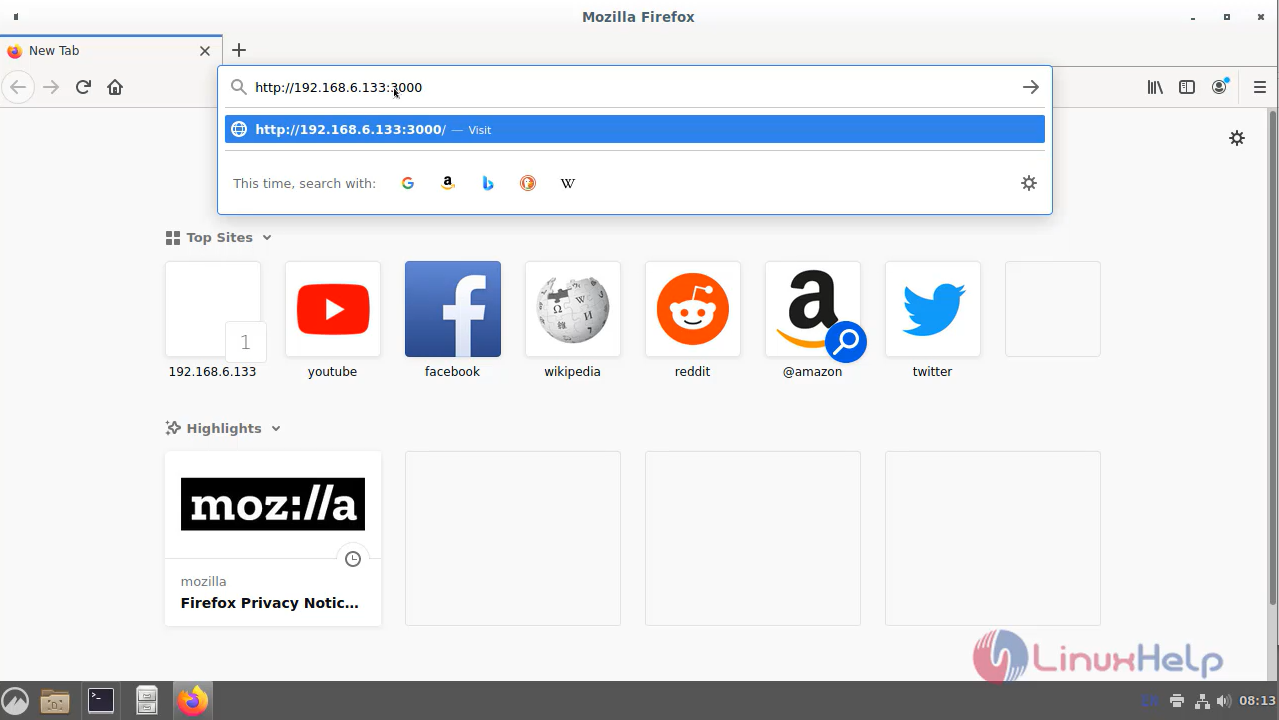
Step 11 : Open the browser and give IP address and default port number as show in the below image
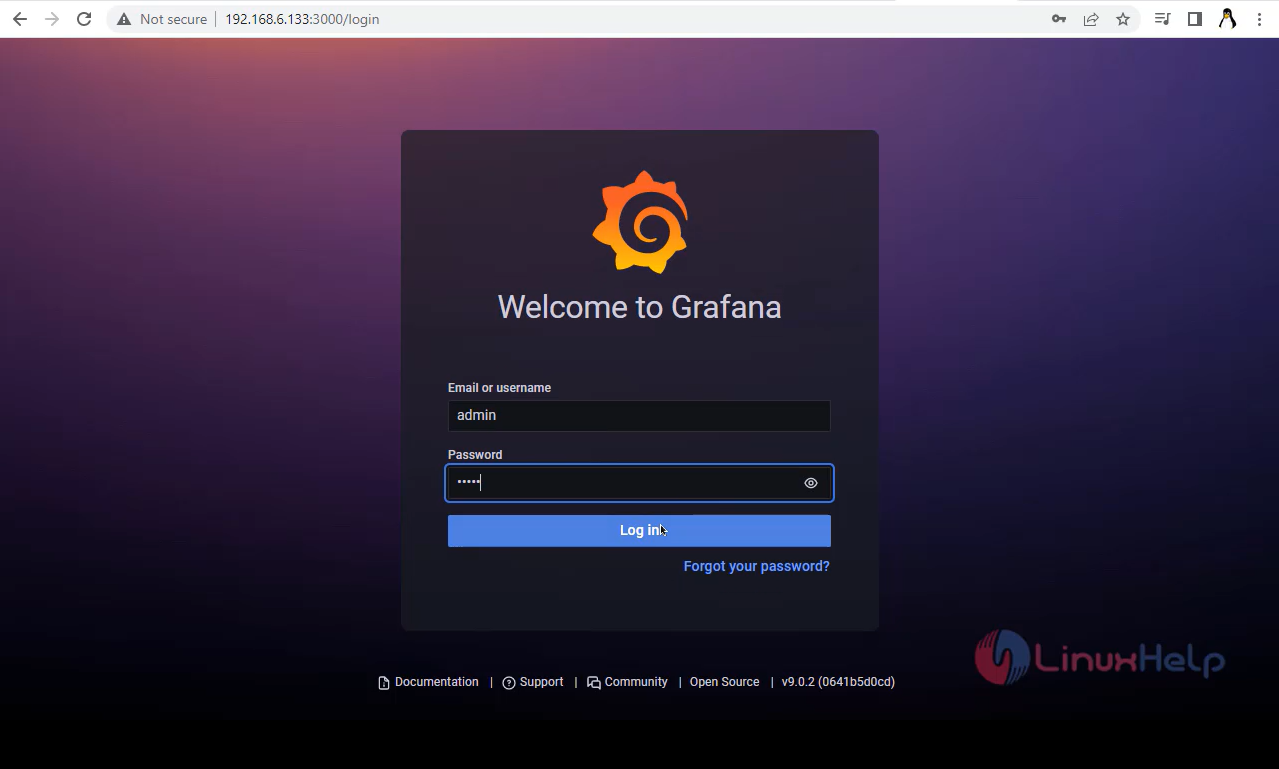
Step 12: Give the default password and change the new password as shown in the below image
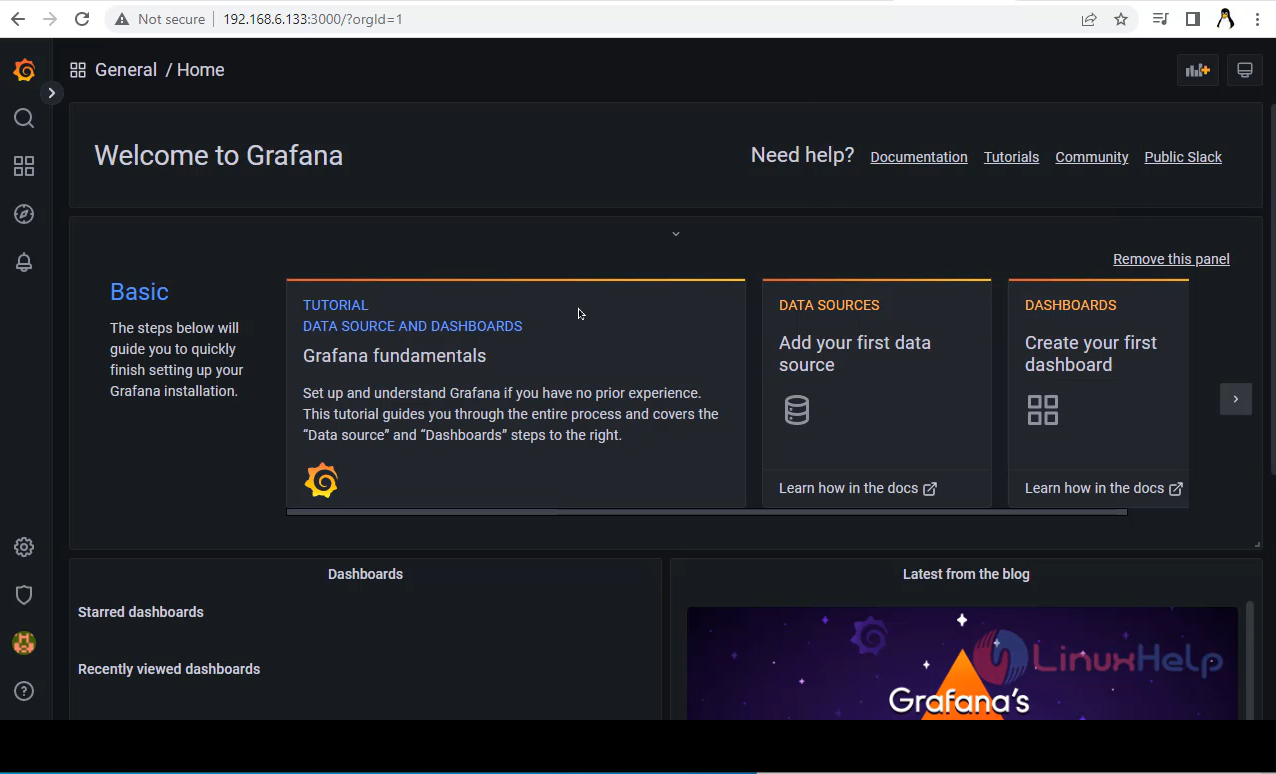
Step 13: This is the welcome page of Grafana
Conclusion:
We have reached the end of this article. In this guide, we have walked you through the steps required to Install Grafana On Linux Debian 11.3. Your feedback is much welcome.
Comments ( 0 )
No comments available