How to Install Grafana on Ubuntu 18.04
To Install Grafana on Ubuntu 18.04
Grafana is open source data visualization and tracking suite. It supports databases such as Graphite, Elasticsearch, Included, Prometheus etc. The application has a metric analytics, with the capability to control and create your own dashboard to your own apps or infrastructure performance monitoring. The method to install Grafana on Ubuntu 18.04 is covered in this tutorial, in a very simple and easy manner.
Installation
In order to install Grafana, you need to add a repository to your source file, and for that, you need to run the following command.
root@linuxhelp1:~# echo ' deb https://packagecloud.io/grafana/stable/debian/ jessie main' > /etc/apt/sources.list.d/grafana.list
And after that, you need to add the key for the newly added repository by making use of the following command
root@linuxhelp1:~# curl https://packagecloud.io/gpg.key | sudo apt-key add -
  % Total    % Received % Xferd  Average Speed   Time    Time     Time  Current
                                 Dload  Upload   Total   Spent    Left  Speed
  0     0    0     0    0     0      0      0 --:--:-- --:--:-- --:--:--     0^C
gpg: signal Interrupt caught ... exiting
Later, you need to update the repository by running the following command.
root@linuxhelp1:~# apt-get update
Hit:1 http://security.ubuntu.com/ubuntu bionic-security InRelease
Hit:2 http://in.archive.ubuntu.com/ubuntu bionic InRelease
Hit:3 http://in.archive.ubuntu.com/ubuntu bionic-updates InRelease
Hit:4 http://in.archive.ubuntu.com/ubuntu bionic-backports InRelease
Get:5 https://packagecloud.io/grafana/stable/debian jessie InRelease [23.2 kB]
Get:6 https://packagecloud.io/grafana/stable/debian jessie/main amd64 Packages [6,583 B]
Fetched 29.8 kB in 10s (2,839 B/s)
Reading package lists... Done
Once all the above steps are completed, you shall carry on with the installation of Grafana in the following manner.
root@linuxhelp1:~# apt-get install grafana -y
Reading package lists... Done
Building dependency tree
Reading state information... Done

The following packages were automatically installed and are no longer required:

  apache2-bin apache2-data apache2-utils libapr1 libaprutil1 libaprutil1-dbd-sqlite3
  libaprutil1-ldap

Use ' sudo apt autoremove'  to remove them.

The following NEW packages will be installed:
.
.
Not creating home directory `/usr/share/grafana' .
### NOT starting on installation, please execute the following statements to configure grafana to start automatically using systemd
sudo /bin/systemctl daemon-reload
sudo /bin/systemctl enable grafana-server
### You can start grafana-server by executing
sudo /bin/systemctl start grafana-server
Processing triggers for systemd (237-3ubuntu10) ...
Processing triggers for ureadahead (0.100.0-20) ...
Once it is done, you shall reload the daemon service by making use of the following command.
root@linuxhelp1:~# systemctl daemon-reload
And then, you need to enable the Grafana server by using the following command.
root@linuxhelp1:~# systemctl start grafana-server
root@linuxhelp1:~# systemctl enable grafana-server
Synchronizing state of grafana-server.service with SysV service script with /lib/systemd/systemd-sysv-install.
Executing: /lib/systemd/systemd-sysv-install enable grafana-server
Created symlink /etc/systemd/system/multi-user.target.wants/grafana-server.service &rarr  /usr/lib/systemd/system/grafana-server.service.
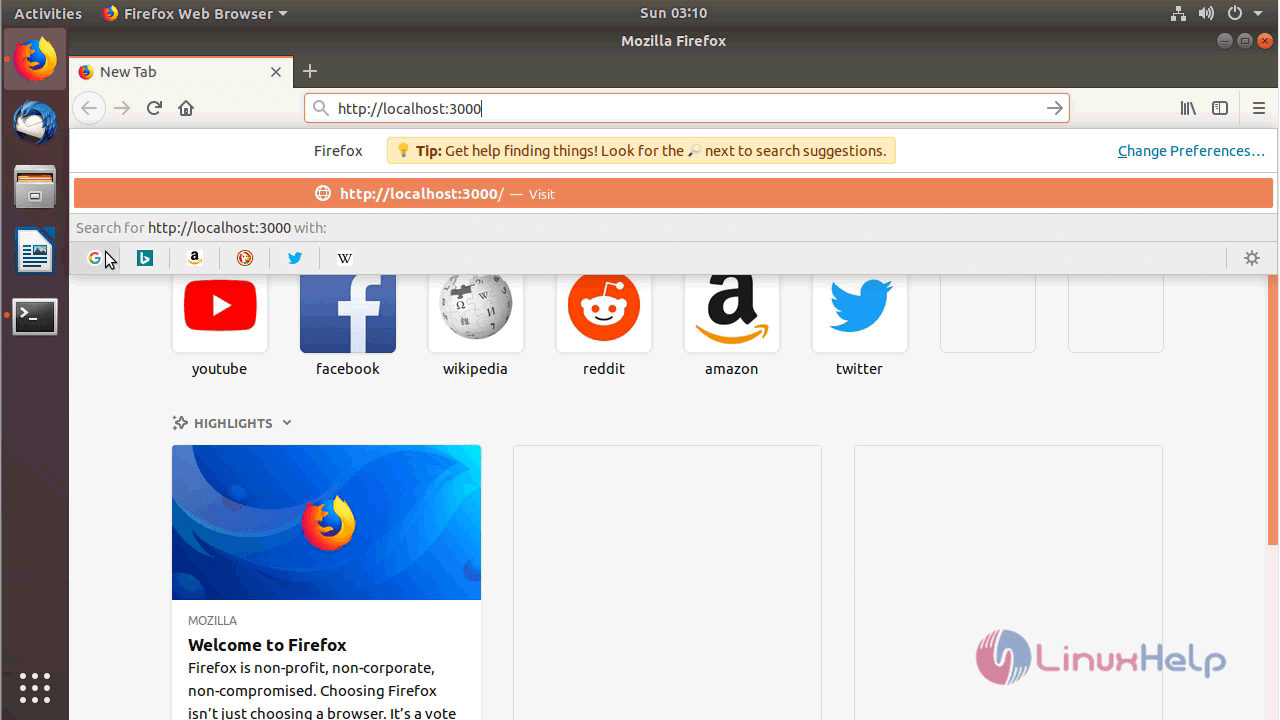
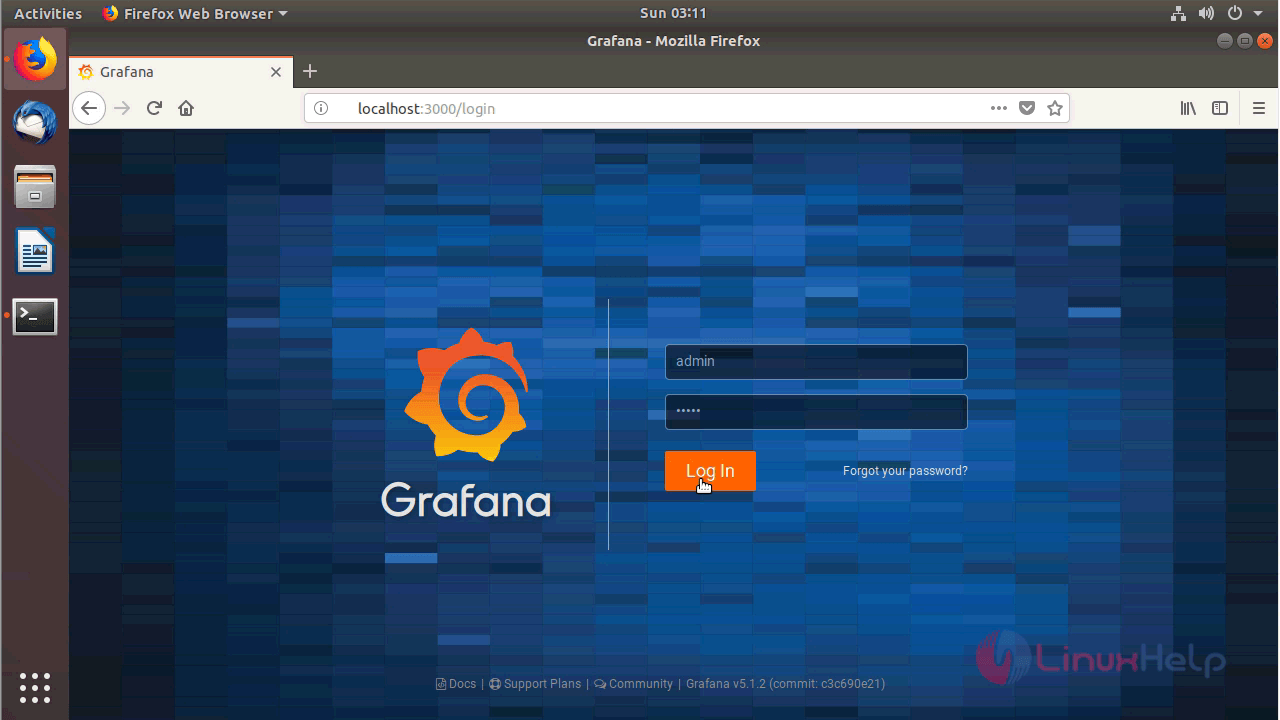
After the above step, you shall open your browser give http://localhost:3000 as your URL. The login page of Grafana appears on your screen. Enter your username and password both as admin and click the Log in button.
Once you’ ve logged in, you will be taken to the Grafana browser.
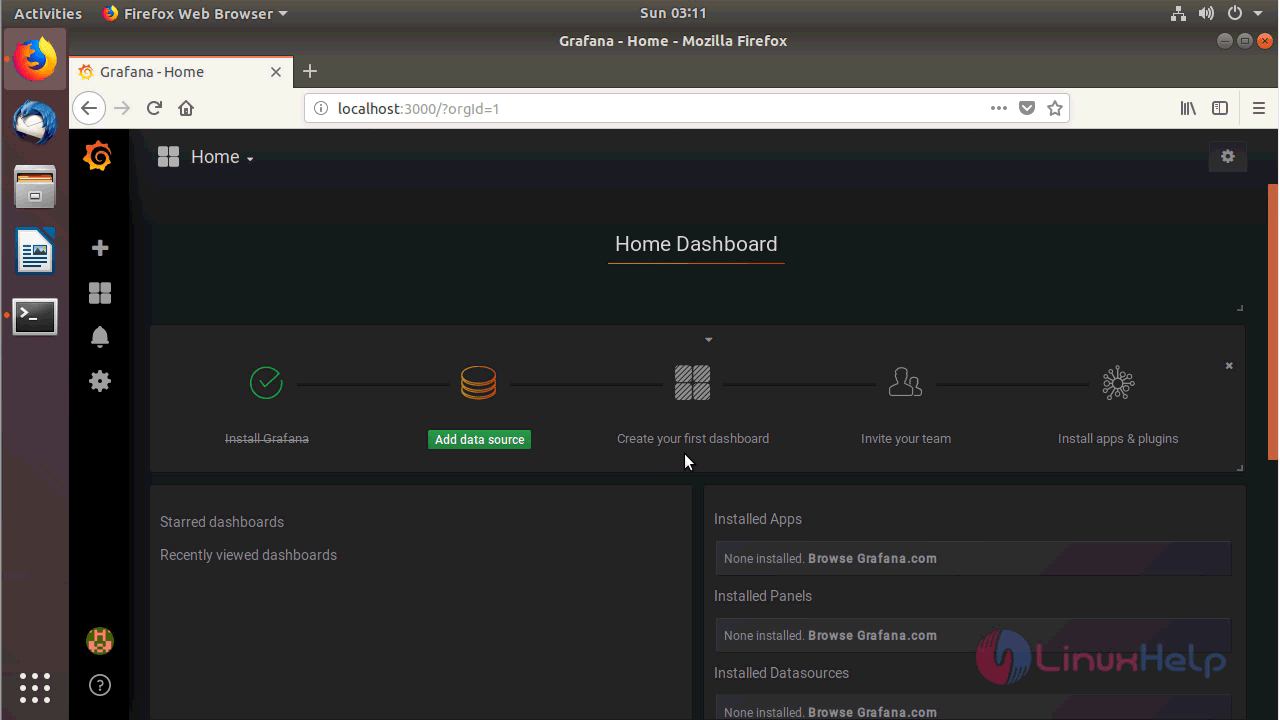
With this, the method to install Grafana on Ubuntu 18.04 comes to an end.
Comments ( 0 )
No comments available