How to monitor Linux system performance using Glances tool
Glances Tool - Monitoring Linux system performance
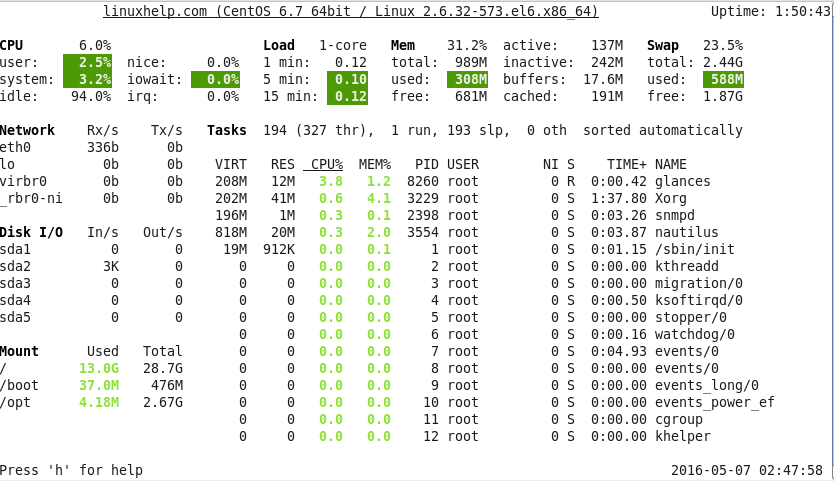
Glances is a cross-platform command-line text based tool to monitor your system. It is written in Python language and uses the psutil library to get information from the system. Using it, you can monitor CPU, Load Average, Memory, Network Interfaces, Disk I/O, File System spaces utilization, mounted devices, total number of active processes and top processes.
Features
- CPU Information’ s user related applications, system core programs and idle programs.
- Total memory Information including RAM, Swap, Free memory etc.
- The average CPU load for the past 1min, 5mins and 15 mins.
- Network Download/Upload rates of network connections.
- Total number of processes, active ones, sleeping processes etc.
- Disk I/O related (read or write) speed details.
- Shows the current date and time at bottom.
- Currently mounted devices disk usages
- Top processes with their CPU/Memory usages, Names and location of application.
Installation of glances
First install the glances package by running the following command. Make sure that, before you install this glances package you should install and enable the epel repository.
[root@linuxhelp Desktop]# yum install glances
Loaded plugins: aliases, changelog, fastestmirror, kabi, presto, refresh-packagekit, security, tmprepo, verify, versionlock
Loading support for CentOS kernel ABI
Setting up Install Process
Loading mirror speeds from cached hostfile
* base: centos.webwerks.com
* epel: ftp.cuhk.edu.hk
.
.
.
Installed:
  glances.noarch 0:1.7.4-1.el6
Dependency Installed:
  python-psutil.x86_64 0:0.6.1-1.el6
Complete!
Launch the glances tool
Execute the below command to launch the Glances tool.
[root@linuxhelp Desktop]# glances
If you want to highlight the CPU status information press ‘ c’ .

If you want to highlight the memory status information press ‘ m’

If you want to highlight the process based on name press ‘ p’ .

If you want to highlight the Input and Output status information press ‘ d’ .

The Glances color codes

GREEN - Everything is OK.
BLUE - Careful state.
VIOLET - warning state.
RED - Critical state.
To remove warning and critical notifications
Remove the warning notification press w.

Remove the critical notification press x.

To refresh the glances to every n seconds
If you want to refresh the glances to every n seconds, use option ‘ t’ with glances and specific time delay. Here, we have mentioned 3 seconds which means my glances terminal will refresh every 3 seconds.
[root@linuxhelp Desktop]# glances -t 3
To check version of glances
[root@linuxhelp Desktop]# glances -v Glances version 1.7.7 with PsUtil 2.2.1
Use glances in Remote
To Connect your glances in remote, use glances with option -s.
[root@linuxhelp Desktop]# glances -s Glances server is running on 0.0.0.0:61209
Now go to your client machine and type your server IP to monitor server in remote.
[root@linuxhelp Desktop]# glances -c 192.168.5.82

Configuration file of Glances
In this configuration file of glances, if you want to make any changes like color code notification you can do here.
[root@linuxhelp Desktop]# vim /etc/glances/glances.conf

Comments ( 0 )
No comments available